Open Service Mesh aims to create a high-performance service mesh while providing all the essential service mesh features. This document describes the tests performed to evaluate the performance and scalability of OSM.
Testing environment
This test is performed on a Kubernetes cluster provisioned and managed by Microsoft Azure Kubernetes Service. The cluster has 62 Standard_D32s_v3 nodes (each node has 32 vCPUs and 128GB memory). That gives us around 2000 vCPUs. During the test, it is ensured that there is only one OSM controller pod running with default resource quota. OSM is configured with non-permissive traffic mode.
Process
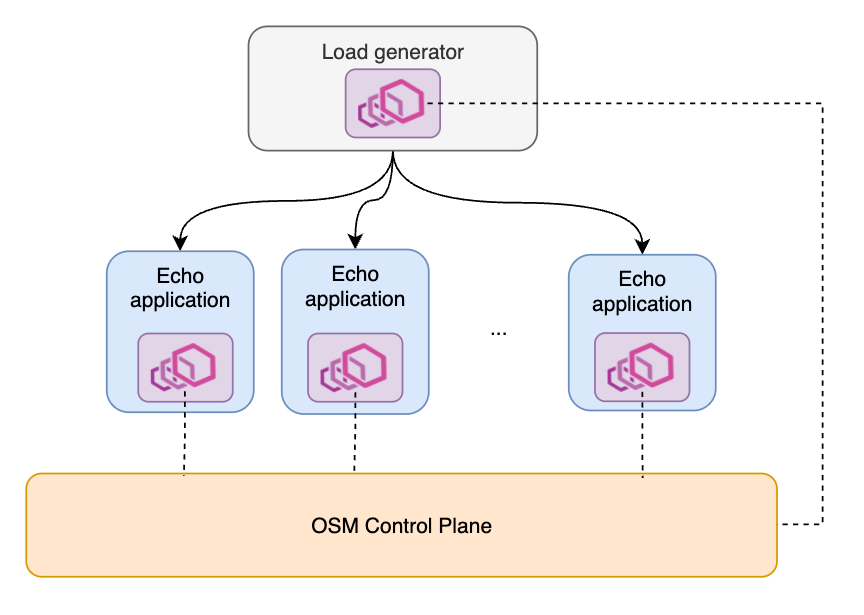
The testing mesh contains two types of services. One is a load generator (modified from wrk2), which can send requests at specified rate, load balanced among all other services in the mesh. Currently we test HTTP/1 requests only. The load generator serves as the client side of a request. Throughout our test, there will be at most one load generator service. The other type of service is a simple echo application that replies with whatever it receives from an inbound request. It serves as the server side of a request. We can deploy multiple copies of the echo application in the mesh. In short, the mesh topology is a typical 1-to-N service architecture.
Performance
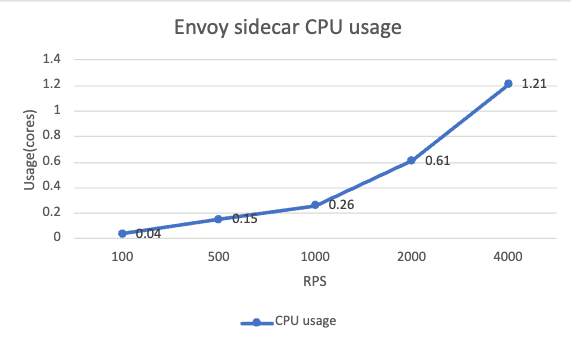
In this section, we focus on the request latency and resource consumption added by the OSM sidecar. We will test the per pod request rate at 100, 500, 1000, 2000 and 4000 RPS respectively.
Latency
Test 1: Relation with request rate
In this test, the workload receives requests at various request rates. In order to save the bandwidth of the cluster, only one workload pod is set up and monitored.
Regardless of the request rates, OSM adds around 1ms and 4ms overhead to the 50th percentile and the 99th percentile latency respectively compared to the case without OSM (please refer to the chart in the Ingress traffic section below). This is caused by the request processing in both the client and server sidecars, for tasks like mTLS authentication, metrics collection etc. Our test setup was with a single client and server. Performance may vary with more complex applications, or with different traffic policies set on the mesh.
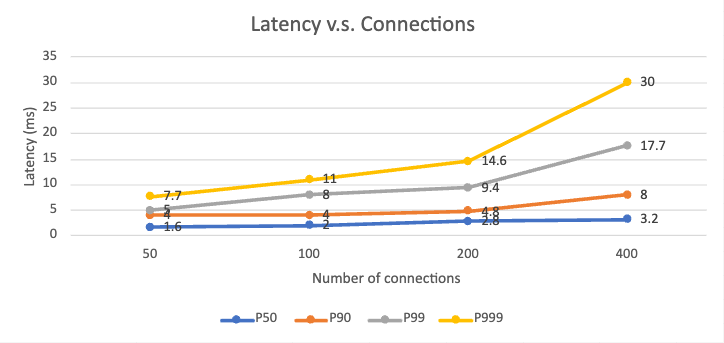
Test 2: Relation with number of connections
A similar setup to request rate scenario is used to test the relationship between latency and number of connections to the sidecar proxy. In this test, the per pod request rate is set at 1000 RPS. As the number of connections increases, the request latency shows a proportional increase while the sidecar memory usage to maintain those open connections only slightly increases. The sidecar consumes around 5MB memory for every 100 connections maintained.
Resource Consumption
Control plane resource consumption is stable as it is not relevant to the data plane request rate.
For the sidecars on the data plane, the memory usage is relatively consistent across different RPS levels, which is around 140MB. The CPU usage has a clear increasing trend and it is nearly proportional to the RPS level. In our case, use a baseline CPU of 60 millicores, the sidecar CPU consumption increases linearly around 0.1 cores for every 100 RPS.
Scalability
In the scalability test, we explore how resource consumption changes for both the control plane and the data plane as the number of workloads in the mesh increases. A specified number of echo services will be deployed to the mesh all at the same time. Therefore, the control plane receives a load spike after the deployment starts. All the Envoy sidecars are connecting to the control plane simultaneously. After that, the control plane becomes much more idle. We deliberately create this load spike at pod rollout time in order to see the maximum scale that the mesh can handle. Each round of test will last for 15 minutes. Mesh scale of 200, 400, 800 and 1600 pods will be tested respectively. The load generator service is not used in scalability test.
Control Plane
CPU Usage
Below shows the CPU usage of control plane at both pod-rollout time and stable time:
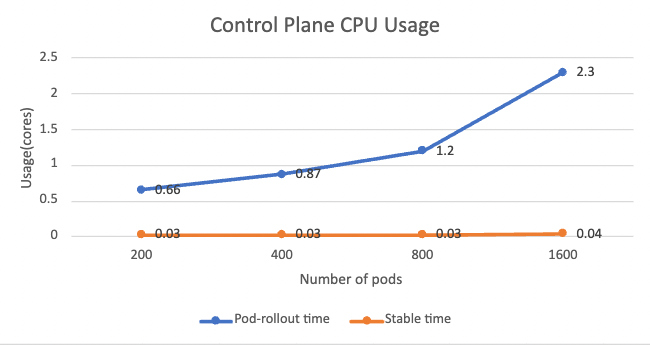
The pod-rollout time CPU usage has a clear increasing trend. This is understandable as the control plane serves all workloads at the same moment, such as issuing certificates and generating xDS configuration. The CPU usage is roughly proportional to the number of workloads. While during the stable time when no new workload is added, CPU usage drops to nearly zero.
Memory Usage
Below shows the memory usage at both pod-rollout time and stable time:
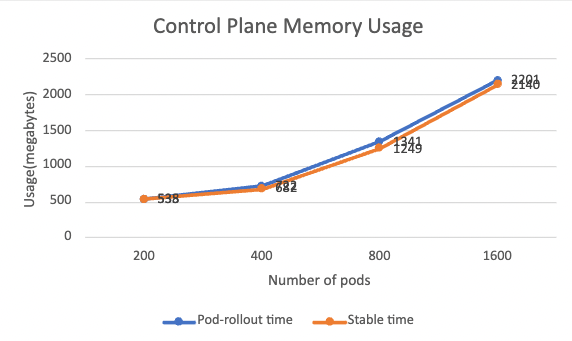
There is not much difference between pod-rollout time and stable time in terms of memory usage. Memory is primarily used to store xDS configurations, which is highly relevant to the mesh scale. The memory usage is also roughly proportionally increasing along with the mesh scale. In our scenario, it takes around 1MB of memory for every one pod added to the mesh.
Sidecar injection
Sidecar injection speed is also measured. In the test, we keep one osm-injector and osm-controller pod respectively. With the default resource quota, OSM adds around 100 pods/minute to the mesh. At this moment, osm-injector hits its CPU resource limit at 0.5 cores.
After increasing its resource quota to 2 cores, OSM adds around 200 pods/minute. osm-injector uses up to 0.8 cores during the test where CPU quota is no longer the bottleneck.
To further increase the sidecar injection speed, it is recommended to scale upo the osm-injector Kubernetes deployment.
Data Plane
By looking at the collected metrics, in our testing scenarios, resource consumption of data plane sidecars does not change much along with the mesh size. At stable time, the average CPU usage is close to 0 and average memory usage is around 140MB. CPU usage is related to request processing and memory usage is related the size of Envoy configuration stored locally. These two factors do not change with the mesh scale.
Other Scenarios
Permissive mode
When permissive mode is enabled in OSM, services are allowed to communicate with any other services in the mesh without additional traffic policies. This is implemented by adding an allow-all wildcard RBAC policy in the inbound listener and all known services as outbound clusters in the Envoy sidecar. Permissive model still enable mTLS authentication between services and requires the services be added inside the mesh. The same load test described above is performed on a service mesh with permissive mode enabled.
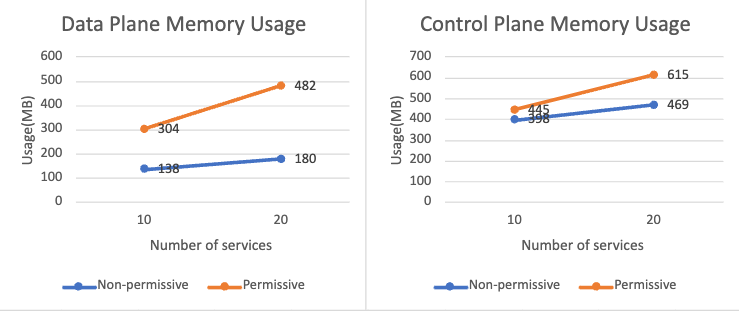
On the control plane, the CPU and memory usage both increase compared to non-permissive mode.
On the data plane, there is no obvious difference in terms of CPU usage. However, the memory usage is much higher in permissive mode. This is expected as more outbound cluster information is stored in the sidecar. The chart below shows the sidecar memory usage when 10 and 20 services are added in permissive mesh and non-permissive mesh respectively. Compared to the non-permissive mode, the memory usage is more than doubled.
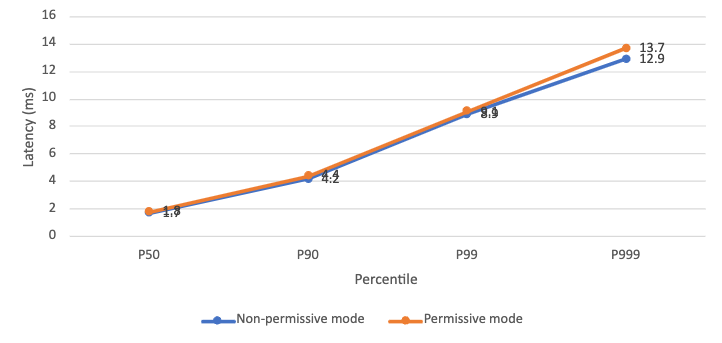
The request latency from load generator to workloads is at the same level regardless of permissive mode. In both modes, the RBAC policy filter chain contains one rule, allows either all requests or requests from one specific source. Thus, they perform similarly. But we expect that with more rules in the filter chain, the non-permissive mode will cause higher latency.
Ingress traffic
In this test, the load generator is deployed outside of the mesh. The requests enter the mesh via IngressBackend.
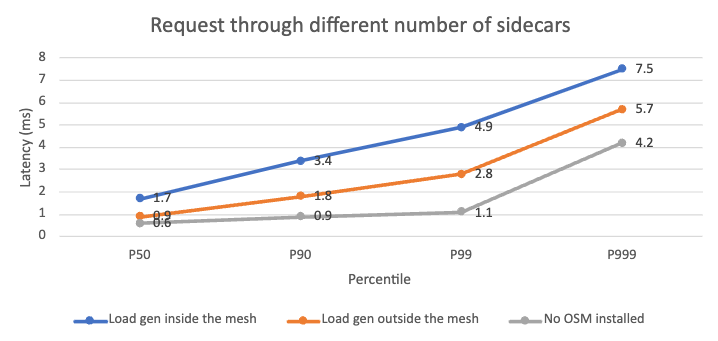
We compared these three scenarios:
- Normal: The load generator is inside the mesh. The request goes through 2 sidecars.
- Ingress: The load generator is outside the mesh. The request goes through only 1 sidecar.
- No OSM installed: Request does not go through any sidecar.
The test result shows that in the ingress scenario, the request latency is significantly lower than the normal scenario. It confirms that request going through an extra Envoy sidecar does add latency overhead. This complies with our expectation.
Feedback
Was this page helpful?
Glad to hear it! Please tell us how we can improve.
Sorry to hear that. Please tell us how we can improve.